Key Performance Indicators to Increase Profits & Cash Flow

EWH COGS Diagrams

KPIs to Increase Profits & Cash Flow

Part 1


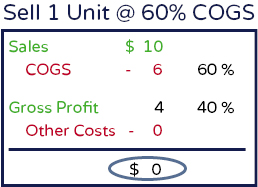
Below is an illustration of the ABC Company whose Cost of Goods Sold rose from $6 a unit to $8 a unit as it expanded its production from 1 Unit to 2 Units. A 33% increase (2/6) took its COGS from 60% of sales to 80%.


KPIs Sell 1 Unit at 60% COGS KPIs Sell 2 Unit at 80% COGS


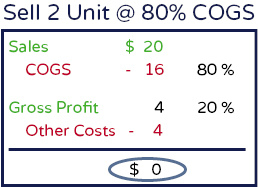
This jump from 60% to 80% is a difference of 20%, costing this company $4 , Sales * 20% ($20 * 20% )

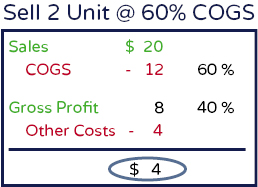
So, instead of this company having a profit of $4, if it had kept it’s COGS at 60%, it was still breaking even with double the sales.

If the company had held its COGS to 60% as it produced more units instead of increasing it to 80%, it would have had a profit of $4.


KPIs Sell 2 Unit at 60% COGS


Learn how to set KPIs in your business and how to manage your business’s cash flow with our Cash Flow Essentials course!

Share://
Facebook
Twitter
Pinterest
LinkedIn
Shopping Cart
Scroll to Top
EWH U Logo

Subscribe to our newsletter.

Sign up to receive helpful tips and executive summaries.

Get Your Complementary Strategy Session

"*" indicates required fields

Optional and Very Valuable Information for Additional Context

These fields are completely optional but will help us better respond to your Inquiry. If this is your first time contacting us this will make the time we connect even better!
Area's do great!
Area's have challenges?
In a couple sentences share where you are, where want to be and how would you define success 1-3 years from now, or 30-90 days from now if that seems more relevant to you. Or do both of course!
What's one thing that will support success most during your response above? What is one challenge or obstacle that could get in the way. Just a couple sentences all together or on each is great.
This field is for validation purposes and should be left unchanged.